
BCG growth-share matrix with examples
Oct 25th, 2022


Every business requires a strategy to set and implement goals and analyze outcomes. An effective business plan takes into account not only the products’ profitability but also the goals for the future. BCG matrix is a perfect tool for analyzing products and business units according to their relative market share and growth. With this model, you can create a diversified and well-balanced business portfolio, develop a future-oriented growth strategy and identify the assets worth investing in.
In this article, we will describe the concept of the BCG matrix in detail and consider examples of matrices for established companies. We will also explain how to apply this model in practice to analyze the potential opportunities for your organization, find underperforming assets and identify products or business units that require additional investment.
What is a BCG matrix?
BCG matrix or Boston Consulting Group growth-share matrix is a model for evaluating business units and product lines in the company’s portfolio according to their relative market share and growth. This long-term strategic planning tool helps companies examine each product's performance. BCG matrix also allows businesses to determine new opportunities for growth and make decisions about their future investments. In addition, with the framework, companies can understand the factors contributing to a product’s failure or success.
Boston Consulting Group matrix is one of the most popular tools for portfolio analysis. It was first drafted by BCG employee Alan Zakon who later enhanced the matrix with his colleagues. In 1970, BCG’s founder Bruce D. Henderson published the essay “The Product Portfolio” in the company newspaper that popularized the concept. As a result, half of Fortune 500 corporations used the analytical tool to choose where to invest during the 1970s and 1980s. The growth matrix continues to be a key component of corporate strategy lessons taught in business schools today. Now it is a perfect framework frequently used by marketers to report findings and pitch new products.
The model takes into account the two guiding principles. Firstly, a company or product with a high relative market share generates substantial profit. Secondly, a business or product in a region with rapid economic growth reveals potential markets. For these reasons, the growth-share matrix is divided into four quadrants based on relative market share and market growth rate. We will discuss the components of the BCG matrix in more depth in the following sections.
Components of BCG matrix
BCG matrix consists of four quadrants with a market share on the x-axis and a market growth rate on the y-axis. The model divides products into four categories: dogs, cash cows, question marks, and stars. Each group has its specific set of distinctive qualities. Let us give a more detailed description of each quadrant.
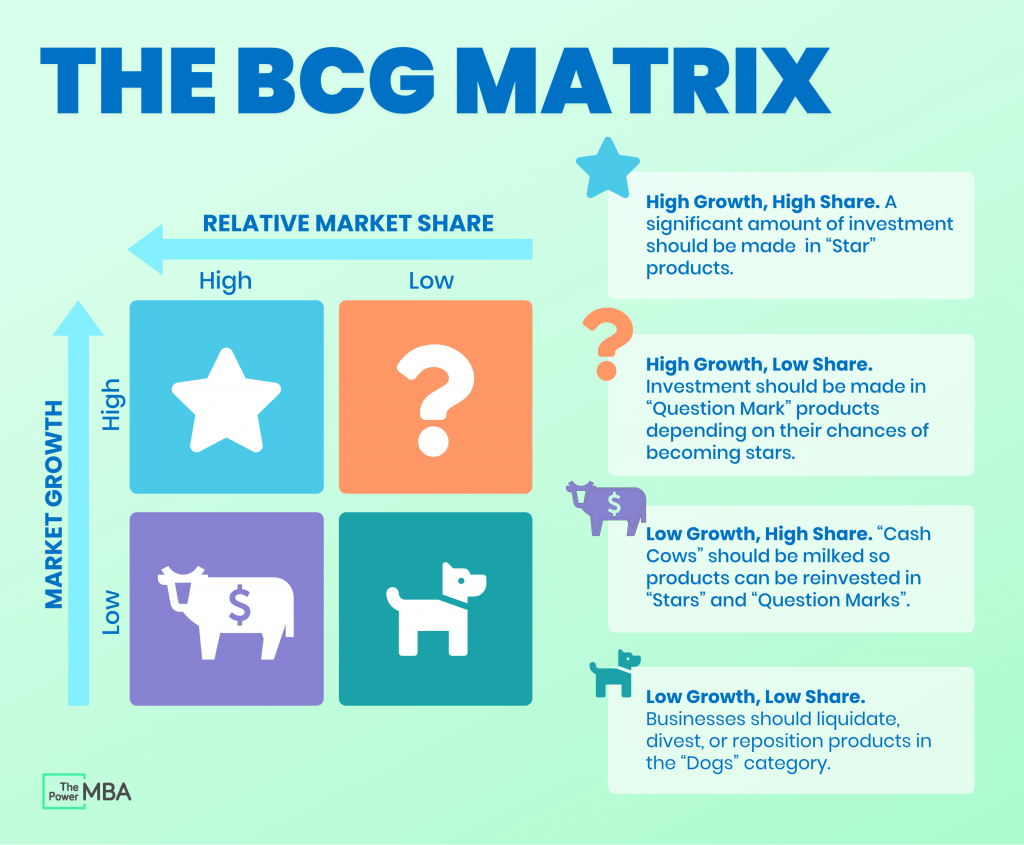
Dogs in BCG matrix
Dogs, also known as pets, are business units or products with a low market share and at a low rate of growth. Products that fall into this category show poor performance and are at the end of their lifecycle. Although dogs can sustain themselves, they will never move into the stars’ quadrant as these products provide low or negative financial returns.
Products in the dogs quadrant are typically seen as cash traps since companies have capital invested in them while generating little or no revenue. Thus, firms can sell, liquidate or rebrand these products or business units. In some cases, dogs can bring profit for an extended time or serve as a response to competitors’ moves. Moreover, these products can be complementary to other offerings. Therefore, companies need to conduct deeper analysis to ensure that dogs are not candidates for investment and can be sold.
What to do with dogs: Try to eliminate any dogs from your product portfolio, and do not waste money on them as they consume resources without any profit.
Cash cows in BCG matrix
Cash cows are products or business units with high market share but low market growth. These products are market leaders that produce higher revenue than they require to keep the business operating. Cash cows are typically associated with well-established and mature products, often in markets with high barriers to entry. Hence these products need less investment to maintain market share. Companies value possessing them because of their ability to generate income. Cash cows provide the resources to cover a business’s operating expenses, finance R&D, invest in new products, and distribute dividends to stakeholders.
Companies should take advantage of cash cows as long as possible. Since cash flow patterns for these assets are incredibly predictable, it is easy to estimate their value. Besides, it allows businesses to maintain the existing level of productivity and finance stars and question marks that have the potential to turn into cash cows in the future.
What to do with cash cows: Focus on these moneymakers and manage them over time to ensure that they continue to generate consistent cash flow that you may later use to develop the stars.
Question marks in BCG matrix
Question marks, sometimes called problem children or wild dogs, are products or business units with a low market share that operate in a high-growth market. Often, startups or new lines of business may fall into this category. As a result, these products often demand significant financial resources to increase their market share. If a company manages to achieve this objective, question marks can turn into stars. Conversely, these products or business units will become dogs when market growth slows.
When the transition from a question mark to a star is doubtful, companies should weigh up divesting these assets and reallocating funds among other portfolio brands. Nevertheless, organizations should conduct a detailed analysis to understand whether these products require investments to increase market share. Businesses should frequently examine question marks to determine whether they are worth maintaining.
What to do with question marks: The question mark can either turn into a star or become a dog in different market conditions. So companies should constantly assess whether the investment they need is justified.
Stars in BCG matrix
Stars are products or units with a high market share that bring the most profit to the company. These products are a company’s most valuable asset at the forefront of the product line. Often, monopolies and first-to-market items are also referred to as stars. If these products maintain their positions as market leaders, they can eventually turn into cash cows when the market’s growth rate slows down.
Stars have significant growth potential that might be used to increase the operating income in the future. Thus, the fundamental component of BCG’s strategy is to invest in stars. This asset generates high income. However, it also requires considerable funds to maintain its position in the target market, keep a competitive edge and accelerate growth.
What to do with stars: Invest in stars since they are valuable assets expected to generate more value because of their fast growth.
Let us examine the examples of BCG matrices for world-famous companies.
Examples of BCG matrices
In this section of the article, we will analyze the BCG matrices of Apple, Coca-Cola, Nike, Starbucks, and Disney to understand their dynamics and identify offerings with high and low growth rates and products that are the sources of loss or have the potential to attract sales.
Apple BCG matrix
Apple’s BCG matrix analysis shows that iPods belong to the dogs category due to intense competition and limited consumer demand. Apple iTunes, MacBook, and iMac can be placed in the cash cows quadrant since these products have maintained their market dominance and increased cash flows at the same time. The company has invested significant sums in developing new product features to stay ahead of the competition and gain a substantial market share. In addition, these products allowed the brand to build a strong customer base that exclusively prefers Apple’s offerings.
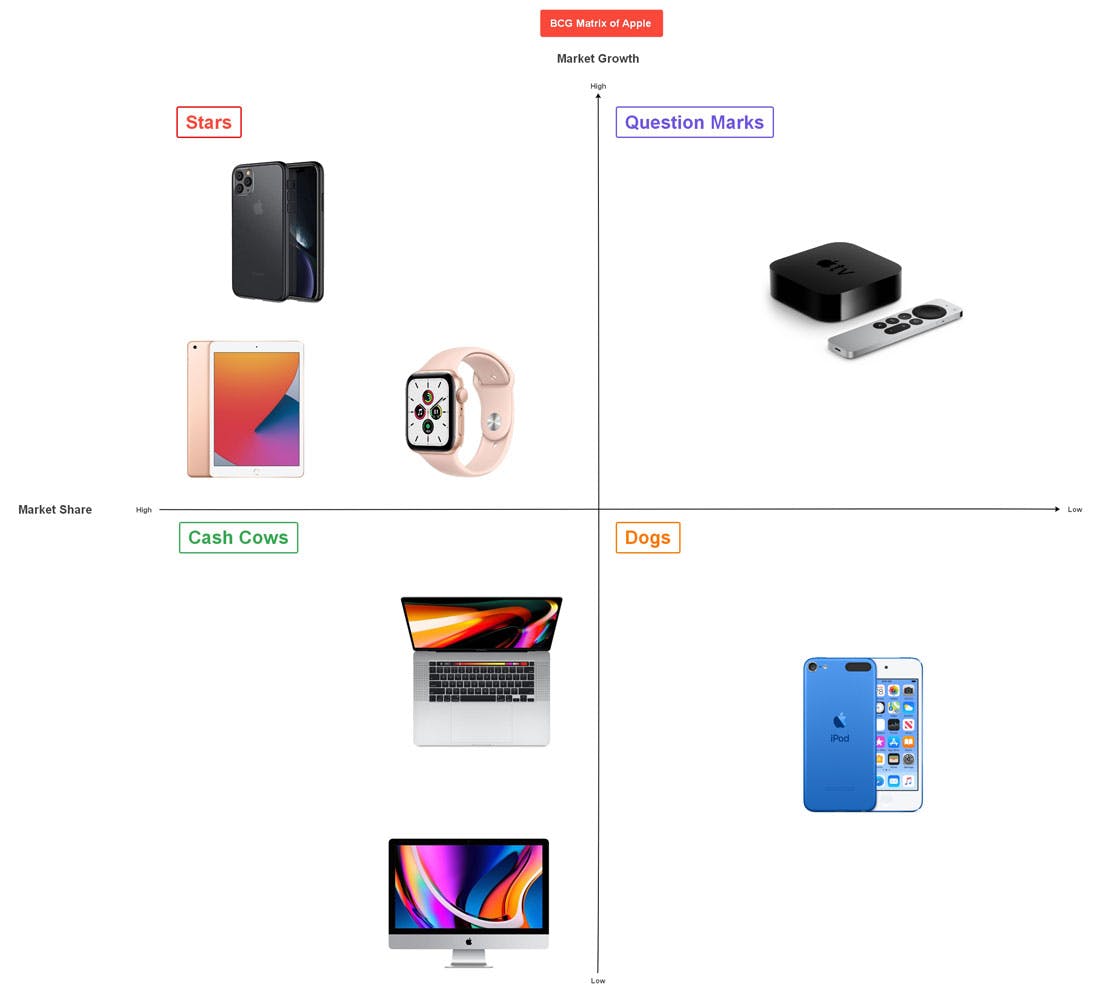
Apple’s question marks quadrant in the BCG matrix is represented by Apple Smart TV. This product generates revenue, but if the brand resolves the problems with its ecosystem, Apple TV has the potential to move into the stars category. Now, the stars quadrant contains iPhone, iPad, and Apple Smartwatch as these products have a loyal consumer base and set new sales records every year. Furthermore, the company invests a sizeable portion of its revenue in R&D and consistently improves its products.
Coca-Cola BCG matrix
Minute Maid and Diet Coke fall into the dogs category due to the sales decline, which is the result of the growing popularity of healthier beverages. At the same time, Coca-Cola is a cash cow and an industry leader that produces significant revenue. Strong brand awareness and global presence made Coke the first brand that comes to mind when consumers think of a carbonated drink.
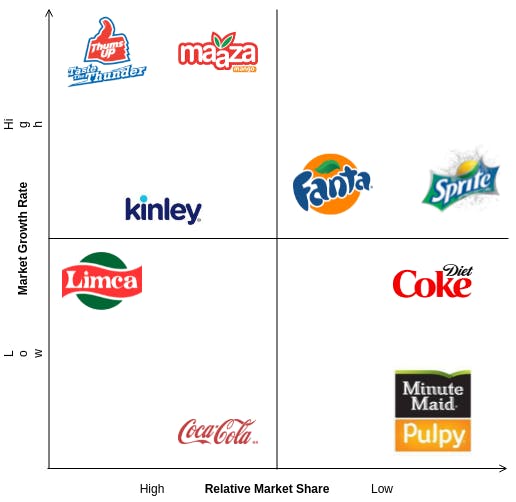
Fanta and Sprite are placed in the question marks quadrant of the BCG matrix. These brands have not experienced the same success as Coke. However, the products achieved sizeable sales volumes in various regions. Finally, Kinley offered in European markets, Maaza and Thums Up, particularly popular in India, are considered the stars in Coca-Cola’s BCG matrix. As the mineral water industry is expanding fast, these products are expected to grow the market share and provide excellent opportunities for investment.
Nike BCG matrix
We can place Nike Skateboarding products in the dogs quadrant since these offerings are not very popular among the skateboarding community. However, the company continues to produce skateboarding shoes and clothing despite a large number of competitors. Nike’s cash cow in the BCG model is footwear. For the past 25 years, the company has been a market leader in this sector and constantly releases new types of footwear.
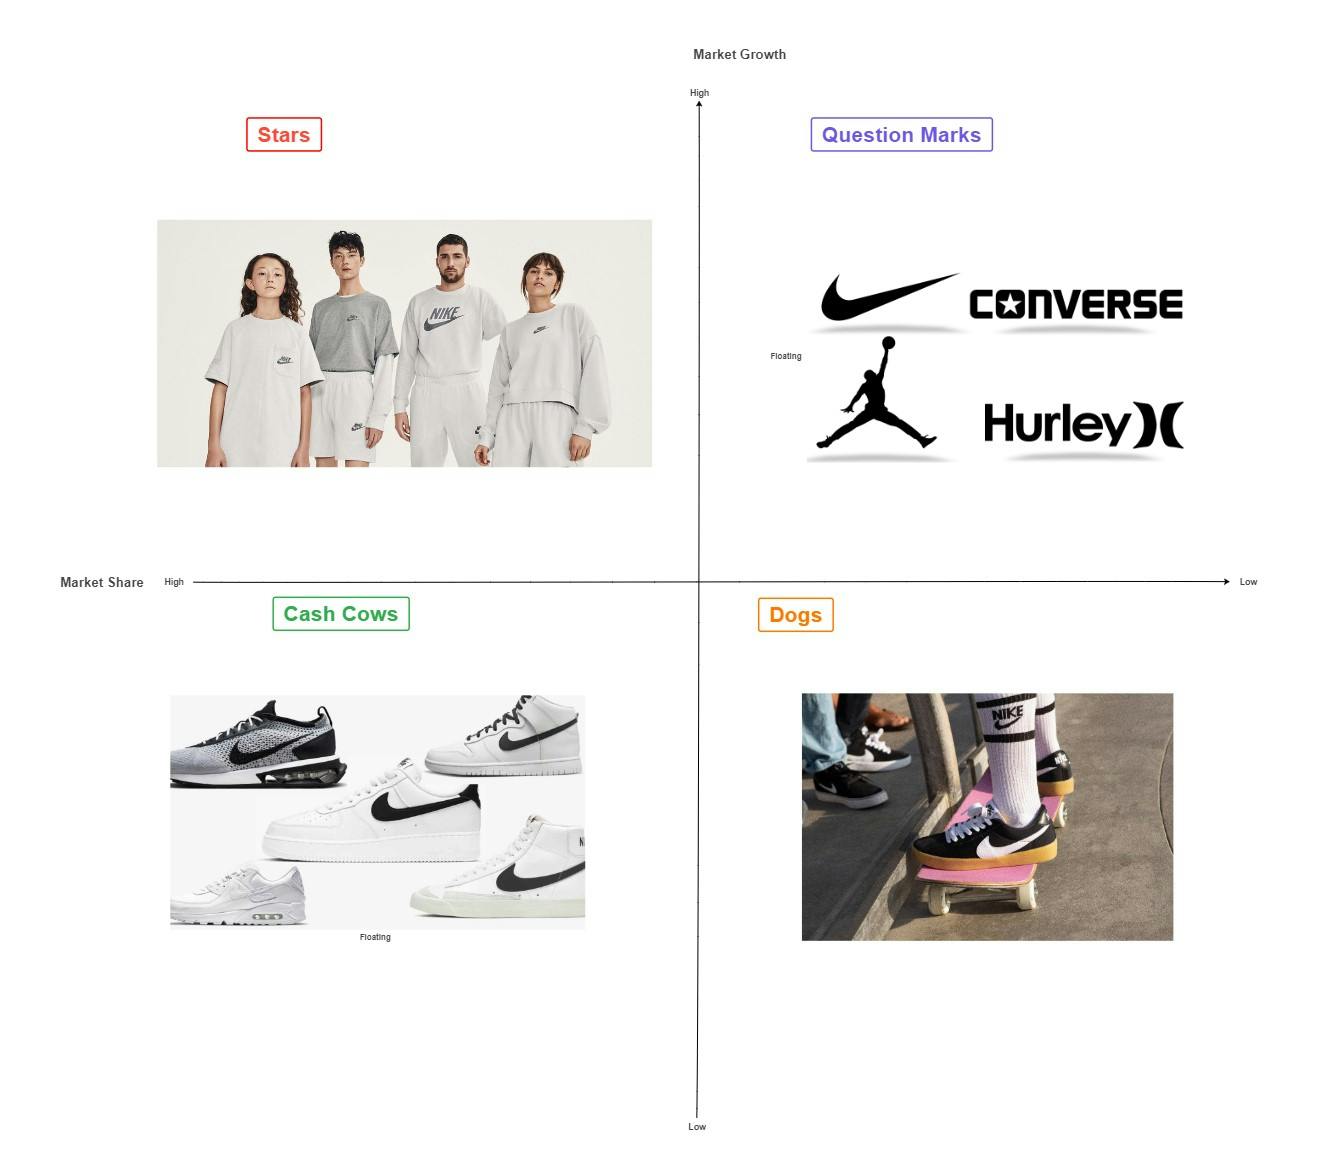
Nike’s brands Jordan, Converse, and Hurley fall into the question marks category. Many athletes switched to rival brands and stopped wearing Converse. On the other hand, Jordan and Hurley have the potential for development. These brands can increase sales if they implement a robust strategy. Nike's clothing and apparel market share is still rising, so these products are regarded as the company’s stars.
Starbucks BCG matrix
Dogs quadrant in the Starbucks BCG matrix is represented by packaged coffee beans. Since customers visit Starbucks for fast service, the company does not generate much profit from selling coffee beans. However, mugs are Starbucks’ cash cows as people purchase them during certain seasons, so these products provide significant revenue.
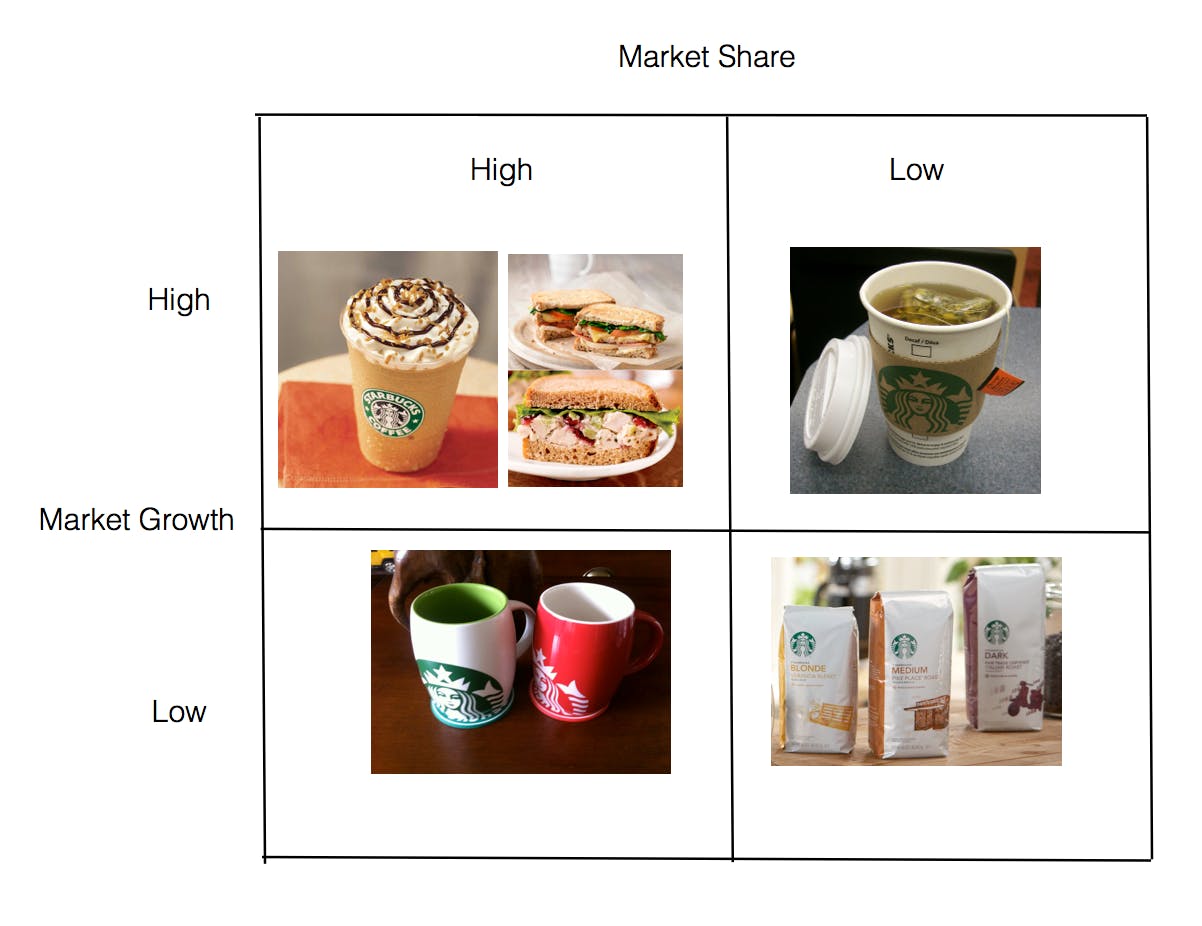
Tea belongs to the question marks category, as Starbucks is better known for its coffee. At the same time, this product has many competitors in the market, such as Twinings. Therefore, Starbucks can examine the causes of its low market share and develop methods to increase it in a growing market. Coffee and packed food are Starbucks’ stars as these products bring in a handsome share of profits, and the company continues to invest money to promote and improve these offerings.
Disney BCG matrix
Due to its slow growth and low market share, the Walt Disney Company's Consumer Products division can be placed in the dogs quadrant. In addition, this segment has dramatically suffered during the COVID pandemic, so the company closed at least 60 stores in North America in 2021.
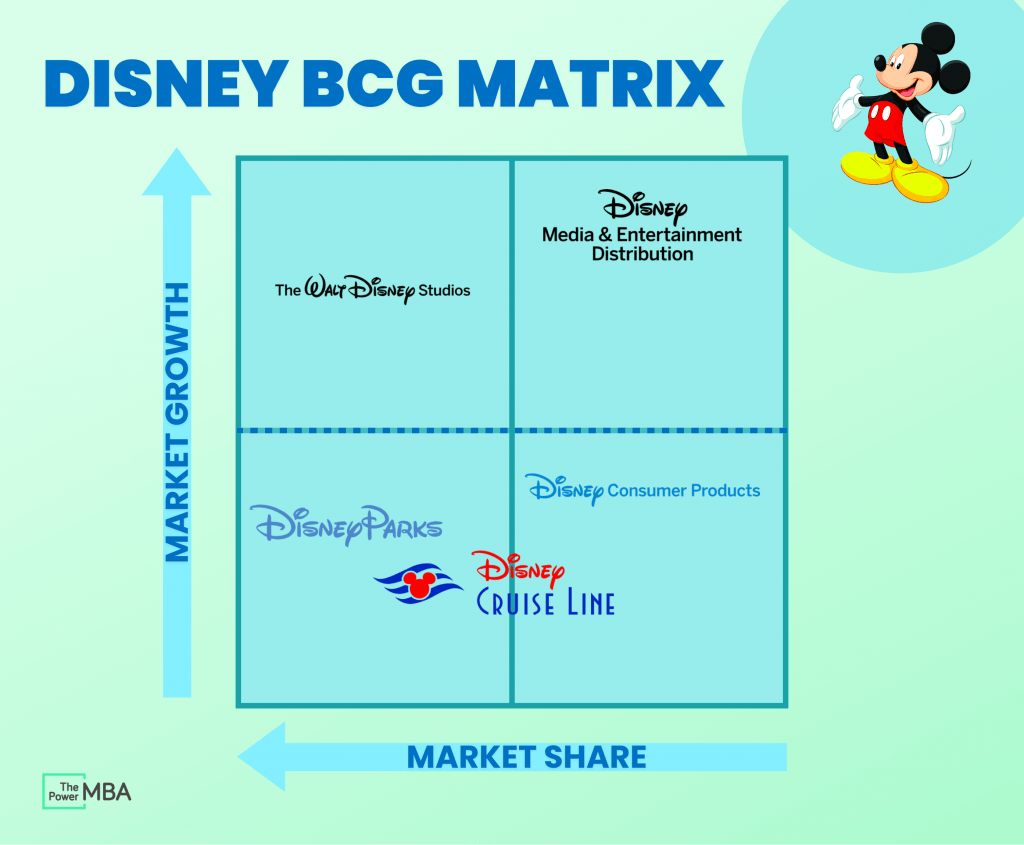
Disney’s theme parks in California, Orlando, Hawaii, Hong Kong, Paris, and Shanghai are the company’s cash cows. The organization constantly adds new attractions to the parks, so they maintain a leading position in the mature market.
Disney’s Media and Entertainment segment, which includes ABC, The Disney Channel, Disney+, ESPN, and Hulu, belongs to the question marks category. Although this asset provides about half of the company’s total profit, it operates in a giant market with a relatively small market share. Finally, Walt Disney Studios falls under the stars category as it accounts for 25.5% of the total box office market share in the U.S. and requires further investment to maintain its position.
Once we have considered the examples, let us focus on creating a BCG matrix for your business unit or product lines.
How to use BCG matrix?
If your company has a substantial portfolio of brands, it can be challenging to decide how to choose the one for investment, especially if the products’ features, performance, and future prospects differ a lot. In this case, you can use the BCG framework or its alternative, the GE McKinsey matrix.
GE McKinsey matrix is a nine-box model that evaluates products or business units on two axes: competitive strength of a unit and industry attractiveness. The competitive strength of a product or a business unit takes into account the following factors: the company’s profitability, total market share, customer loyalty, market share increase compared to rivals, the strength of a value chain, and product differentiation level. Industry attractiveness is determined by such factors as industry size, structure and profitability, changes in the product cycle and demand, price trends, macroenvironment, seasonality, market segmentation, and labor availability.
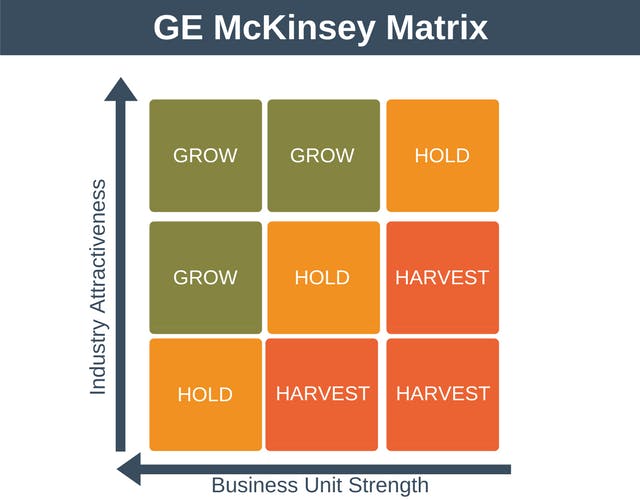
BCG matrix is more straightforward than the GE McKinsey model as it focuses on fewer factors and consists of four cells instead of nine. We will pay greater attention to the former as it is easier to plot and understand. Now we will list several steps to help you use the BCG model.
Step 1. Define the units and market for analysis
It is crucial to choose brands or business units and focus on the right market, as it greatly affects the results of the analysis. A poorly defined market might result in the incorrect classification of products. For example, if we analyze Mercedes-Benz in the passenger car sector, we will conclude that it falls under the dogs category. Yet it will be a cash cow in the luxury automotive market.
Step 2. Determine the relative market share
Market share is the percentage of a company’s total sales generated in a particular sector. You can calculate it by unit volume or revenue. The formula for measuring relative market share is as follows:
Relative Market Share = Annual product sales/Leading competitor’s sales per year
Step 3. Learn the market’s growth rate
The next step is to find information about the industry growth rate in online sources. You can also estimate it by looking at the average revenue growth of the top companies. The formula for calculating the market’s growth rate is provided below:
Market growth rate = Product’s sales for year one - Product’s sales for year two
Step 4. Plot the products or business units on the matrix
After calculating the required metrics, you can add the products to the table according to the relative market share and market growth axes. You can also draw a circle for each product or business unit. The circle’s diameter reflects the percentage of sales the asset brings in.
Categorizing products in smaller organizations can be challenging because the relative market share is too tiny to measure using the BCG Model. Additionally, it is predicated on the idea that increasing marketing expenditures will also increase market share. However, it is an ideal tool for mid and large companies to determine which areas of their operations should be prioritized and which ones can be eliminated. The matrix also helps develop a successful business strategy for the future.