
YouTube Analytics: best practices, metrics and tools
Feb 23rd, 2022


Contents
What is YouTube Analytics and how to use it?
8 critical YouTube metrics to grow your channel
Best tools for analyzing YouTube performance
YouTube algorithms are constantly changing, and as a result, the competition on the platform becomes more intense. Due to this reason, any action taken to enhance your channel performance will make you stand out from the competitors and lead to success. YouTube Analytics may provide insights into best-performing videos, their audience, average viewing time, engagement, and the topics relevant to subscribers’ interests.
Monitoring YouTube Analytics metrics to improve your video content performance is crucial for any YouTube marketing strategy. By tracking YouTube metrics, such as views, audience demographics, keywords, and traffic sources, you can learn the essential data about your viewers’ behavior, tailor your content to fit the needs of your target audience, and understand what motivates people to watch your videos.
What is YouTube Analytics and how to use it?
YouTube Analytics is the website’s analytics dashboard that allows monitoring key indicators, such as viewer demographics, likes and dislikes, watch time, click-through rates, and traffic sources. By utilizing this YouTube channel data, you can spot current trends, receive a channel performance report and understand what strategies will bring the best results for your channel.
The purpose of the YouTube Analytics tool is to determine the effectiveness of your video marketing efforts. The first step is to set the goals and identify the most crucial metrics to track. For example, your objectives could be to grow the audience, increase your average video engagement, market your product or brand. In that case, you need to focus on the particular metrics to fine-tune the content strategy and create videos relevant to the needs of the viewers.
If your objective is to get more views, you need to monitor the number of views, average view duration, watch time, and average percentage viewed. If you want to grow the audience, pay attention to the number of gained and lost subscribers. Track views, shares, new comments, and subscribers if your goal is to improve engagement.
How to use YouTube Analytics?
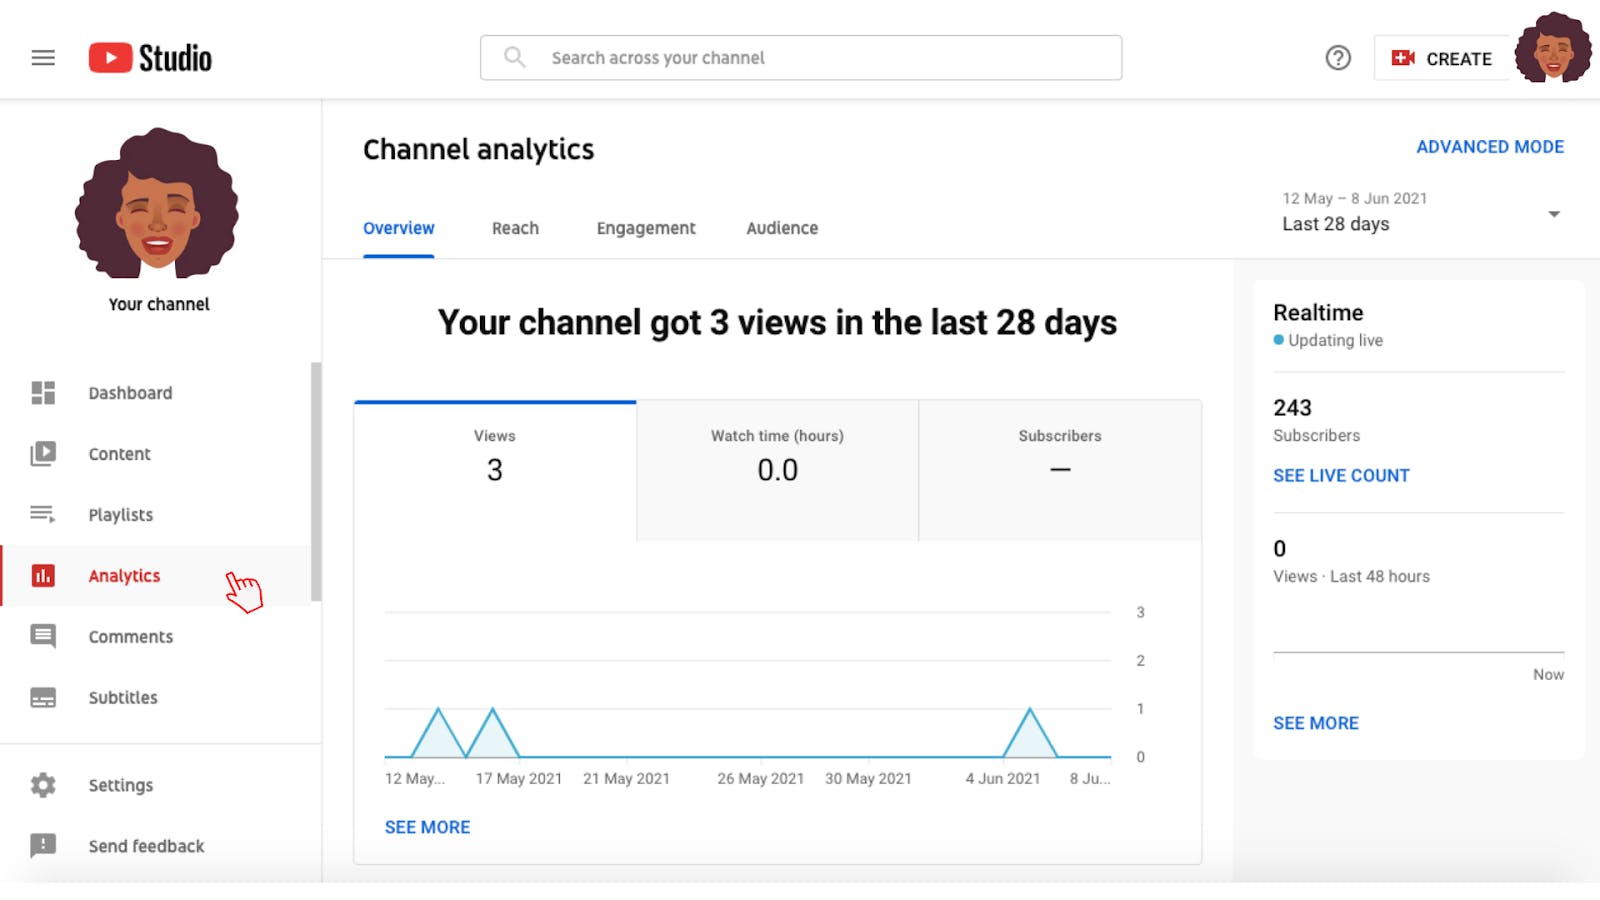
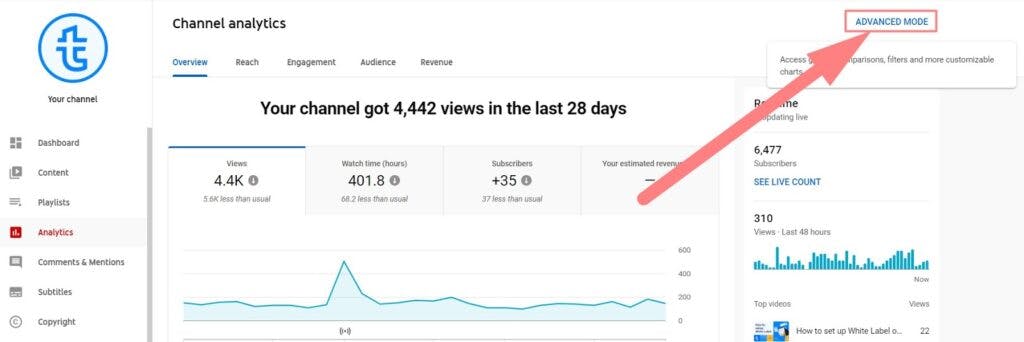
To access the metrics, sign in to YouTube Studio and select Analytics from the menu on the left. This view displays the variety of metrics, including sections devoted to Overview, Reach, Engagement and Audience. On the Analytics page, you can examine the data concerning the whole channel. In the Advanced Mode at the top right corner, you can compare several videos via filtered metrics.
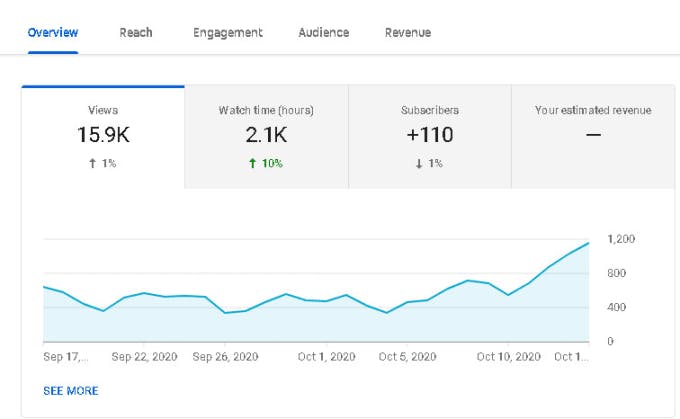
The Overview tab briefly summarizes your channel performance, including the most popular metrics, such as views, watch time, subscriber count, and estimated revenue. In this section, you can see the information related to the best-performing videos, recent uploads and compare the performance of the latest video to the average results of your channel. You can examine the statistics over the last week, month, three months, year and view the data for a certain period or the whole lifetime of the channel.
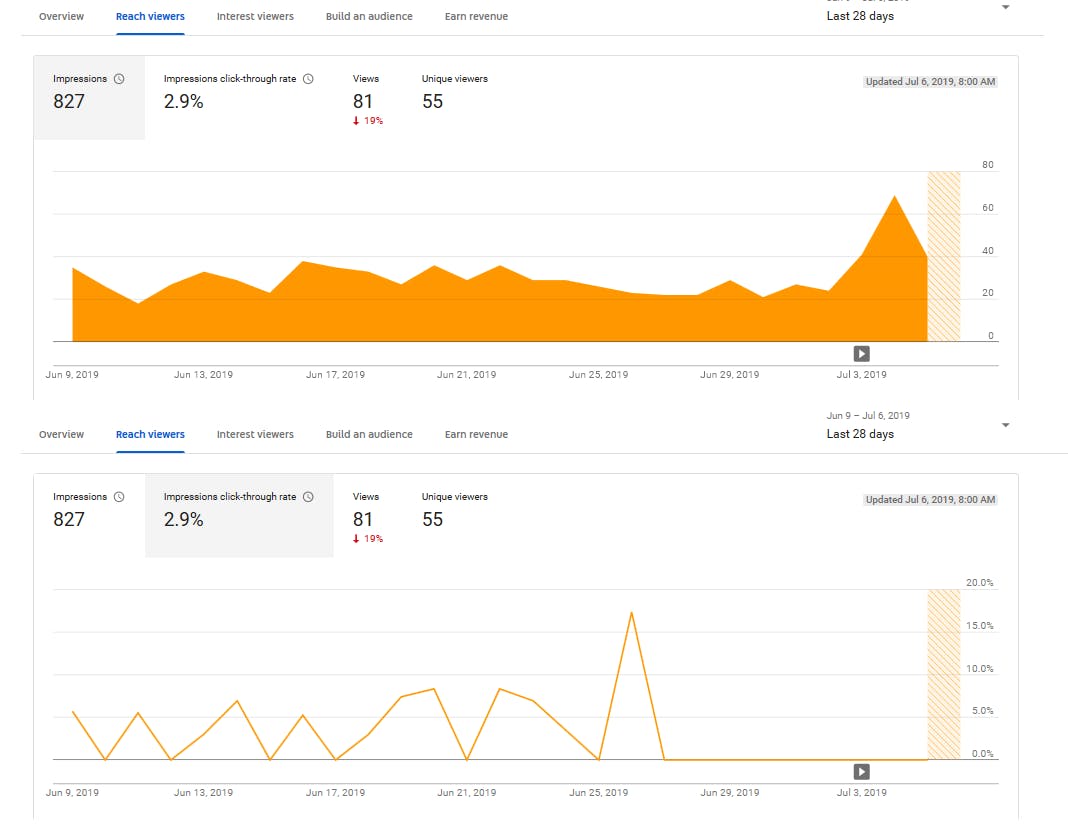
The Reach tab allows you to monitor how the audience discovers your channel. The metrics in this section include impressions, impressions’ click-through rate, views, and unique viewers. Impressions refer to the number of times the potential audience comes across your content. With this metric, you can monitor whether or not your videos appear in YouTube searches.
In the Reach tab, you can track traffic sources or places where viewers find your content, such as external websites, suggested videos, searches, playlists, etc. The percentage of viewers who clicked on your thumbnail and watched the video refers to the impressions click-through rate. If the click-through rate is high, it means that you have chosen the appropriate thumbnail, right keywords, and compelling title. In this section, you can discover the top YouTube search terms - the search queries that people use to find your content on Youtube.
The Engagement tab gives you insights into how people are reacting to your videos. The metrics in this section show average view duration and watch time. The Engagement tab also contains reports for top videos, playlists, and community posts. Card and screen reports show how your viewers interact with the elements in your videos and how effective your visual CTAs are in generating more views and clicks.
The Audience metrics provide data about your viewers and allow you to better understand their needs and preferences. The metrics in this section include unique viewers, subscribers, returning and new viewers, and total members. By tracking these metrics, you can analyze the activity of your target audience across your channel, measure the total amount of watch time that comes from your subscribers, segment your audience by age, gender, geography, and language.
If you are looking for answers to more complicated questions, you can find the additional information in the YouTube analytics section of Google help and reporting section of Google Developers website. In the next part of this article, we will review the essential metrics to measure the performance of your content.
8 critical YouTube metrics to grow your channel
With YouTube Analytics, you can set specific goals, measure progress and transform your video content strategy. The tool provides a wealth of information. First, however, you need to choose the most critical metrics relevant to your objectives. Further, we will describe eight common metrics that are used to evaluate the success of your channel and videos.
Watch time
Watch time refers to the total time the audience has spent watching your videos. This is one of the most crucial metrics as YouTube promotes videos with higher watch times and recommends them in search results, viewers’ home pages, and suggestions. The watch time metric reflects how engaging your video is for the viewers. Likes and comments also play a significant role, but these actions might depend on various additional factors. In contrast, watch time is the indicator of the quality of your content. If you understand the difference between the videos with high and low watch times, you will be able to produce better content.
Besides the overall video watch time, you can monitor the points where the viewers stop watching your videos within YouTube Analytics. Taking into account this data, you can analyze the factors that influence audience retention and better understand the type and length of content to create. Moreover, you can categorize the videos by topics, genres, and duration to determine the most engaging ones.
Views
The views metric indicates how many times the video has been watched. If your goal is to increase the reach of your content, you need to monitor views. You can track this metric for the overall channel or only for particular videos. It is also important to note that the view counts on YouTube once a person watches 30 seconds of a video.
Furthermore, you can look for trends by comparing your channel views over a certain period. Views help identify high-performing videos and a perfect time frame to upload new content. This metric allows you to determine the most popular videos and gain new ideas to change the content strategy.
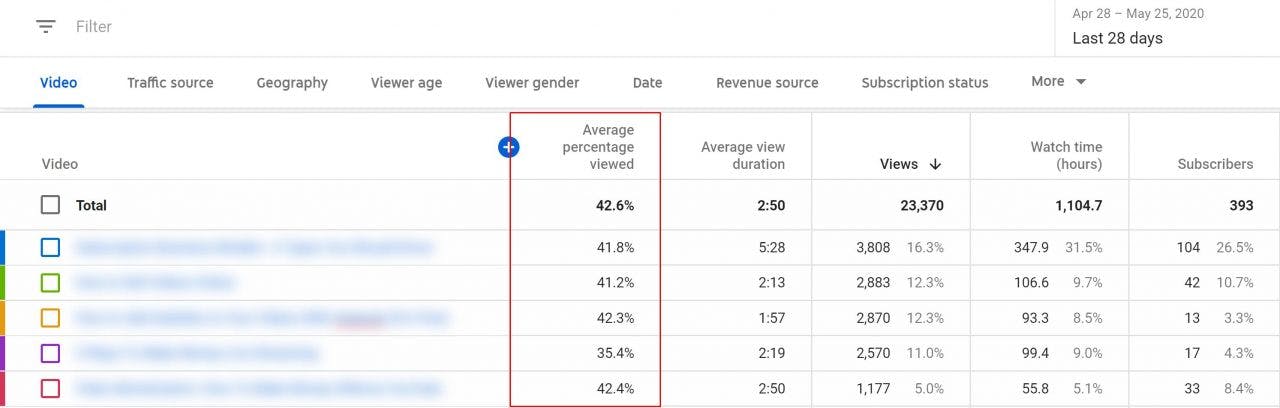
Average percentage viewed
The average percentage viewed is the percentage of each video shown to the average viewer. You can find it in the watch time report. This metric demonstrates the ability of your videos to hold the audience’s interest. By monitoring the average percentage viewed, you will be able to create more appealing and viral content that gets many views. If this indicator is at an excellent level, YouTube will give boost the video in search and recommendation rankings.
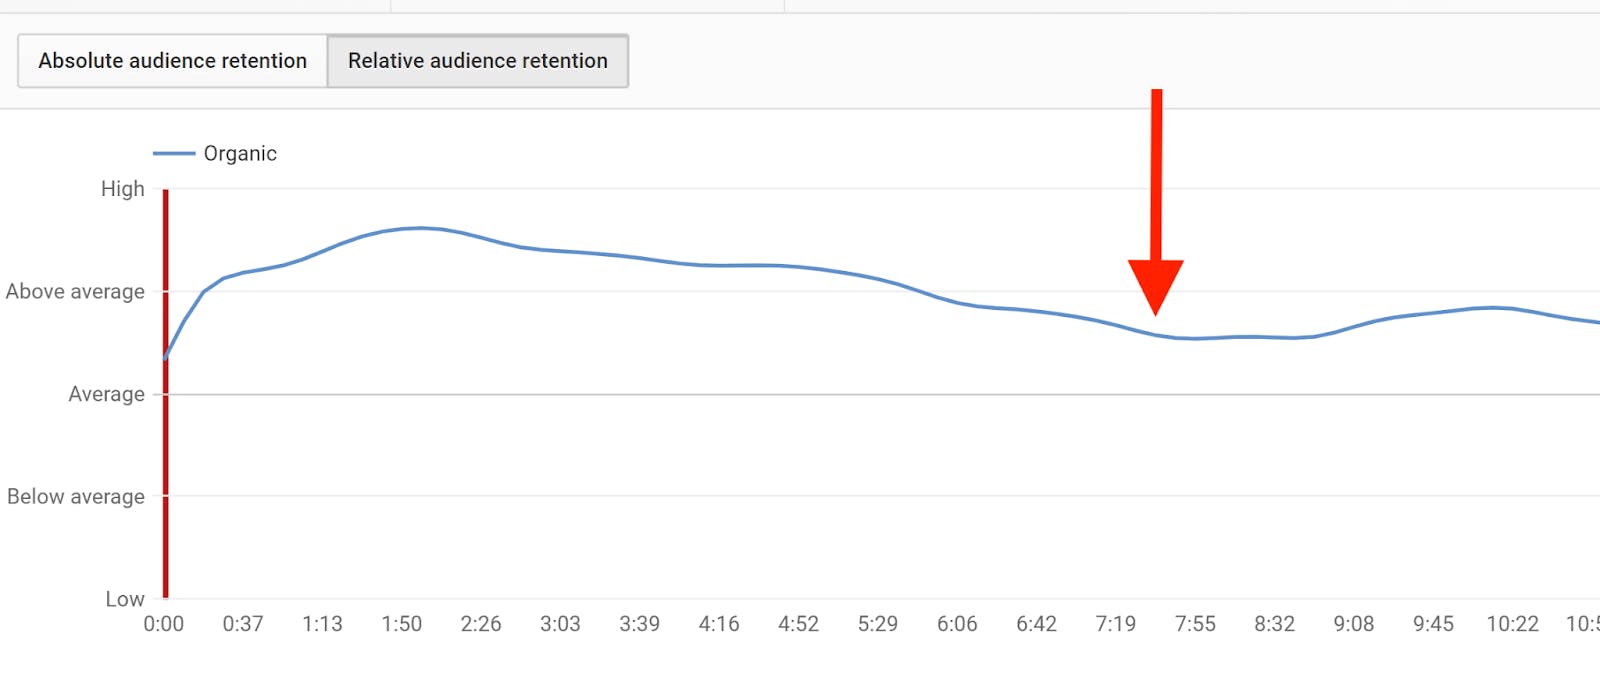
Audience retention
Audience retention displays the percentage of people who stopped watching your video at a particular point. With this metric, you can understand at what moment the audience loses interest in your content and make changes in your videos to retain viewers. Furthermore, you can determine what triggers an adverse reaction to the content at that point and include a call to action to prevent viewers’ from leaving. In addition, if the video captures viewers’ attention, YouTube will recommend it in suggestions and search rankings.
The audience retention report provides two main views, including absolute and relative audience retention. Absolute audience retention shows which parts of your video have caused the greatest interest. You can identify them by looking at the number of views at these points as a percentage compared to the total number of views for a certain video. Moreover, you can use the most engaging parts of your video as topics for future videos. Relative retention allows you to compare your video with other YouTube content of similar length to understand how well it maintains viewers’ interest.
Demographics
Demographics will provide you with a better understanding of your audience, taking into account gender, age, geography, and other characteristics. This data helps you identify the most active viewers and segment your target audience. As a result, you will be able to adapt your content plan to the needs of your viewers and focus on the topics that appeal to them.
Analyze the videos that get the most views considering age groups, genders, and viewers’ locations. Next, pay close attention to the topic and titles to identify what captures the viewers’ attention. Finally, develop an ideal persona that reflects the traits of your core audience. Now you can create content targeted at specific segments that are particularly interested in the topic of your channel.
Traffic sources
Tracking the traffic sources allows you to discover where your viewers are coming from. The three most common traffic sources usually encompass search, suggested views, and the videos on users’ home pages. The other sources might include YouTube channel pages, playlists, and external websites. You need to determine which traffic source is the most valuable for you across the channel and each specific video. However, you should remember that the number of views plays a minor role in this respect as not all sources provide you with traffic of the same quality.
Optimize your content to get more views and promote the channel. Create compelling video titles that emphasize the benefits of the content and include keywords in the video file, titles, and descriptions. Use eye-catching thumbnails and video hashtags. Select a category for your video on YouTube while uploading the file. Add subtitles and closed captions that contain the text of your video.
Subscribers
Subscribers are your most devoted supporters. They watch your videos more frequently than non-subscribers as they receive notifications and see your new uploads on their homepages. Accordingly, the subscribers generate more views for your channel than the unsubscribed part of your audience. Thus, the number of subscribers directly impacts your watch time, engagement, and further promotion of the content.
You can attract more subscribers by using CTAs, such as pitches included in your video or YouTube Cards. In addition, you can calculate the subscriber ratio. You need to divide the number of views by the subscriber count for a specific video. Consider investing extra time and money in a video that performs better than others in gaining subscribers.
Impressions click-through rate
Impressions click-through rate shows how often viewers watch a video after seeing it in recommendations, the home page, or the trending tab. A high click-through rate indicates that your video has a captivating title, and the theme of the video has evoked a profound interest from relevant audiences. You can track this metric together with average view duration and average percentage viewed to see if people who clicked on your video have actually watched it. For example, if your video gets a lot of clicks but has a low average view duration, the audience might perceive it as clickbait or misleading content. On the other hand, a low click-through rate combined with high engagement indicates that the content resonates with a specific but loyal audience.
You can use YouTube Analytics to see if your content reaches the intended audience. This tool helps determine where you should focus your efforts and find areas for improvement. However, there are also other useful third-party tools and websites that can help you analyze YouTube performance.
Best tools for analyzing YouTube performance
YouTube Analytics is not the only tool for evaluating your data. We will review the set of additional tools that will give you insights into your content performance.
Social Blade provides its users access to the public database where you can find valuable information about any content creator, brand, or live streamer. Social Blade pulls data from YouTube’s public API and uses the collected statistics to create graphs and charts measuring users’ progress and growth. In addition, the tool contains subscriber predictions and updates the subscription count in real-time.
VidIQ is a Chrome extension designed for YouTube creators. This SaaS product allows users to find topics and keywords for the videos. VidIQ has an SEO feature that helps create optimized descriptions, tags, and titles. The dashboard shows the number of views, subscribers, and comments on your channel. With this tool, you can also track the traffic sources and determine the best time to post a video for your channel. Moreover, VidIQ collects data from the subscribers who have already installed the extension.
Google Trends is a free tool that allows creators to see search volume trends, get insight into customer behavior and create content based on current trends. The platform has a filter designed to monitor the YouTube trends specifically.
Unbox Social is a tool intended for monitoring your social media performance. The solution provides plenty of useful information and metrics, including the best time to publish videos, video shares, audience retention, subscriber demographics, card clicks, card impressions, and subscriber growth rate. You can also compare your channel performance with the competitors using the YouTube competitor analysis function of Unbox Social.
Creating content for your YouTube channel can be a complex and time-consuming process. To get the most out of your YouTube marketing efforts, you need to track and evaluate your key performance indicators and metrics. YouTube analytics tools will make this task easier and provide complete information about your channel’s success. Then you will be able to use these findings to improve your content marketing strategy and achieve success.