
Perceptual map: how-to, types and tools
Jul 21st, 2022


Contents
What is a perceptual map?
Types of perceptual maps
How to create a perceptual map?
Perceptual map template tools
Many companies have no idea why customers keep buying their products or why people have stopped purchasing from them. Perceptual map will give you the answer to this question. It helps you reveal how existing and potential customers perceive your brand, learn about their motivations and uncover reasons for making purchasing decisions.
Perceptual map is a great tool for marketers and business owners to analyze what customers think about the company and its direct competitors. Once you create a perceptual map, you can evaluate your brand according to a range of parameters, such as quality, price, performance, and reliability. What’s more, you can examine your competitors’ advantages and drawbacks and identify new marketing opportunities.
What is a perceptual map?
Perceptual map, also known as a market map, is a diagram that represents customers’ perceptions of specific features of items, products, or brands. Market researchers and businesses use perceptual maps to understand how their customer base views the relative positioning of other products or brands within a larger ecosystem. Perceptual maps can also aid in identifying market gaps, exploring acquisition possibilities, monitoring trends, finding potential partners, or clarifying perceptual issues with a specific product.
The structure of a map is usually similar to a line graph, with at least two axes. While creating a perceptual map, consumers are asked to put brands or products relative to one another along two or more axes. Market maps help businesses compare specific characteristics and benefits, such as quality and exclusivity, taste and nutritional value, functionality, or price. Thus, brands can make well-informed decisions about how buyers perceive the positioning of different companies.
Perceptual maps are not the same as positioning maps. Market maps compare perceived characteristics of a brand or product, whereas positioning maps evaluate the actual features. The other distinctive quality of perceptual maps is a focus on current or past positioning. Market maps mainly reflect the consumers' impressions of reality and may not be accurate. At the same time, positioning maps measure existing market positioning but mostly pay attention to future goals. In addition, marketers often use perceptual maps as stand-alone tools, while positioning maps cannot be used without the former ones. So, in some cases, perceptual maps and positioning maps may look very similar. However, they represent varying underlying data and analyze distinct parameters.
Next, we will consider different types of perceptual maps and the main purposes of their usage.
Types of perceptual maps
There are five major types of perceptual maps: two-dimensional, multi-dimensional, spidergram perceptual map, joint perceptual map, and intuitive perceptual map. Let us take a closer look at each of these types.
Two-dimensional perceptual map
This perceptual map has two vertical and horizontal axes with opposite attributes at each end. For example, if a map compares several car manufacturers’ quality and price, the vertical axis has a premium price at one end and a low price at the other. The horizontal axis will reflect high quality at one end and poor quality at the other. Depending on how customers perceive brands’ products concerning these criteria, marketers put the companies on specific areas of the map. If some car brands are positioned close to each other, then consumers consider that they have many similar attributes.
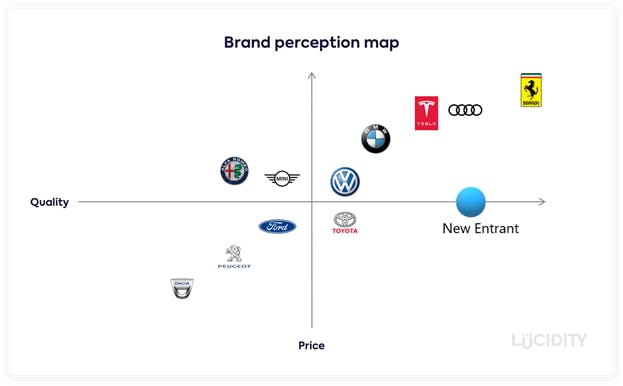
As we see from this example, customers perceive Ferrari, Audi, Tesla, BMW, and Volkswagen as expensive and quality car brands. Consumers view Toyota as a high-quality brand at a reasonable price. MINI and Alfa Romeo are perceived as low-quality automobile manufacturers but costly ones. Finally, Ford, Peugeot, and Dacia are estimated as lower-quality brands at affordable prices.
Multi-dimensional perceptual map
In contrast to traditional two-dimensional perceptual maps, multi-dimensional maps have more than two axes with various attributes. The items are plotted on the map based on their closeness to the vector representing a certain product or brand feature.
A typical method for creating multi-dimensional perceptual maps is a self-organizing map. This machine learning technique reduces data dimensions to a map and reveals similarities in it. In addition, the approach allows for adding more product attributes and brands and conducting in-depth research on factors influencing buyers’ decisions. Thus, with multi-dimensional perceptual maps, marketers can analyze low-involvement purchases and identify market segments.
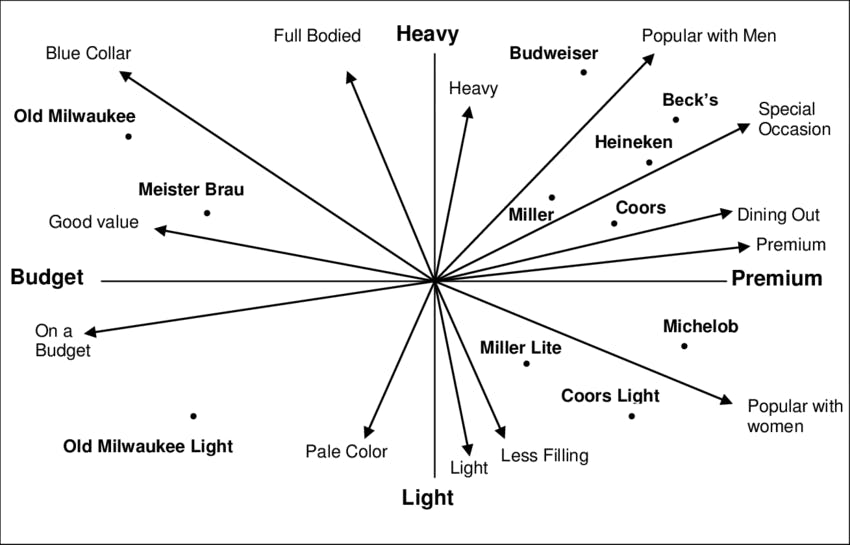
In this example, we can observe customer perceptions of beer brands according to the following attributes: heavy, popular with men, special occasion, dining out, premium, popular with women, less filling, light, pale color, on a budget, good value, blue-collar, full-bodied and heavy. However, the main vectors are price and alcohol content percentage. For instance, Miller, Heineken, and Beck’s are considered rich in flavor, popular with men, and premium-priced beer brands for special occasions. On the other hand, Miller Lite and Coors Light are viewed as light, less filling beers popular with women.
Spidergram perceptual map
Spidergram is a visual marketing tool similar to a perceptual map but requires customers’ rates for a product or brand characteristics. Customers provide data on multiple attributes, which are subsequently analyzed and plotted on a diagram. Consumers’ scores are distributed over several dimensions, allowing for a thorough analysis of the brand and visualization of the entire market. Spider mapping is an effective way to analyze consumer insights and determine whether the product generates the right value at the optimal price.
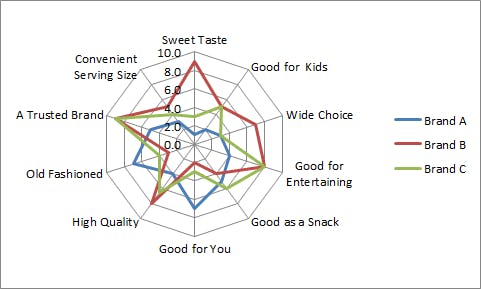
The chart in the example compares ten product attributes for three brands. The spidergram helps compare all brands’ characteristics at once to get an overall idea about each company’s advantages and drawbacks. As we can see from the example, Brand B is a trusted company that produces high-quality, very sweet-tasting cookies in a variety of flavors. On the other hand, Brand A is a savory, reasonably healthy product but it is considered slightly old-fashioned.
Joint perceptual map
Joint perceptual map is a two-attribute diagram that displays the consumers’ perceptions of the competing brands and the preferred needs of the distinct customer segments in the market. This type of perceptual map is constructed using customer surveys where they score products or brands for two attributes. Marketing specialists use joint perceptual maps to analyze the effectiveness of brand positioning and understand the expectations and preferences of various market segments. With joint perceptual maps, businesses can set specific objectives regarding ideal customer needs and take into account key market competitors.
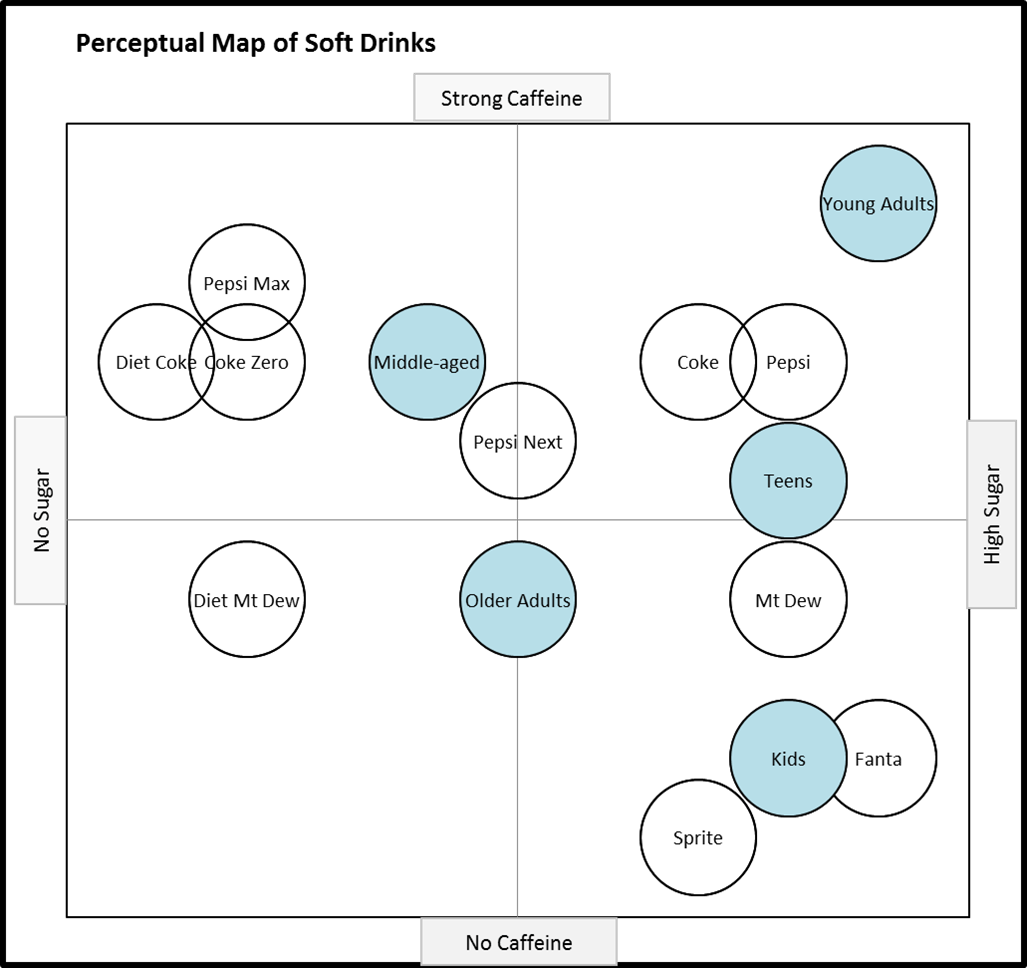
For example, this perceptual map compares soft drinks in terms of sugar and caffeine content. The map also shows the preferences of several market segments depicted as light blue circles. The joint perceptual map uses an age-based demographic segmentation and divides the audience into the following groups: kids, teens, young adults, middle-aged consumers, and older adults.
Let us now examine each separate group in greater detail. As we can see from the map, the young adults’ segment enjoys drinks with a lot of caffeine and high sugar. Thus, Pepsi and Coca-Cola have the best positioning for this market category. Since teens prefer the sweet taste, they choose caffeinated drinks in the middle of the range. Pepsi and Mountain Dew are both well-positioned in this respect. Kids perceive Fanta and Sprite as products that are low in sugar and caffeine, so the drinks are a good fit for the market. At the same time, Diet Coke does not meet the requirements of this segment as it is viewed as a product without sugar but with high caffeine content.
Intuitive perceptual map
Intuitive perceptual map also called a judgmental map or consensus map is constructed by marketers based on their knowledge of the industry. In contrast to other types of perceptual maps, intuitive maps do not account for consumer data. Marketing specialists can use intuitive maps to reveal biases in decision-making compared to other perceptual maps based on in-depth research. The value of a judgemental perceptual map is debatable as it often serves only to confirm the existing preconceptions.
Once we have discussed the types of perceptual maps, it is time to learn how to create them in practice.
How to create a perceptual map?
Now we will discuss the process of constructing a perceptual map step by step. There are four main steps in perceptual mapping, which we will describe below.
Select the attribute dimensions and the type of map
The first step is to define two or more determinant attributes on which customers rely when making purchasing decisions. These parameters depend on your industry and the available information about the consumers. To create an intuitive perceptual map based on your assumptions and knowledge about the industry, you need to choose characteristics relevant to your field.
The other approach implies selecting the attributes according to the results of the market research study. Choose the aspects you want to learn more about and develop a survey with questions that will provide you with the required information. Distribute the questionnaire to your clients and select the number of attributes depending on the type of perceptual map you are going to construct. The attributes may include design, style, functionality, convenience, price, quality, customer service, etc. Focus on your business objectives and consumer pain points to choose the parameters suited for your perceptual map.
List your main competitors
The following step is to create a list of five to ten brands or products. Run a focus group discussion and ask the participants to name the products in your market. Use brainstorming tools like sticky notes, whiteboard, or online resources to collect the answers.
Then conduct the competitive analysis to identify your direct and indirect competitors and reveal the strengths and weaknesses of your company and products. Consider a description of your target market, customer feedback, information on your product or service, and differences in your marketing strategies.
Rate competitor’s products and complete the map
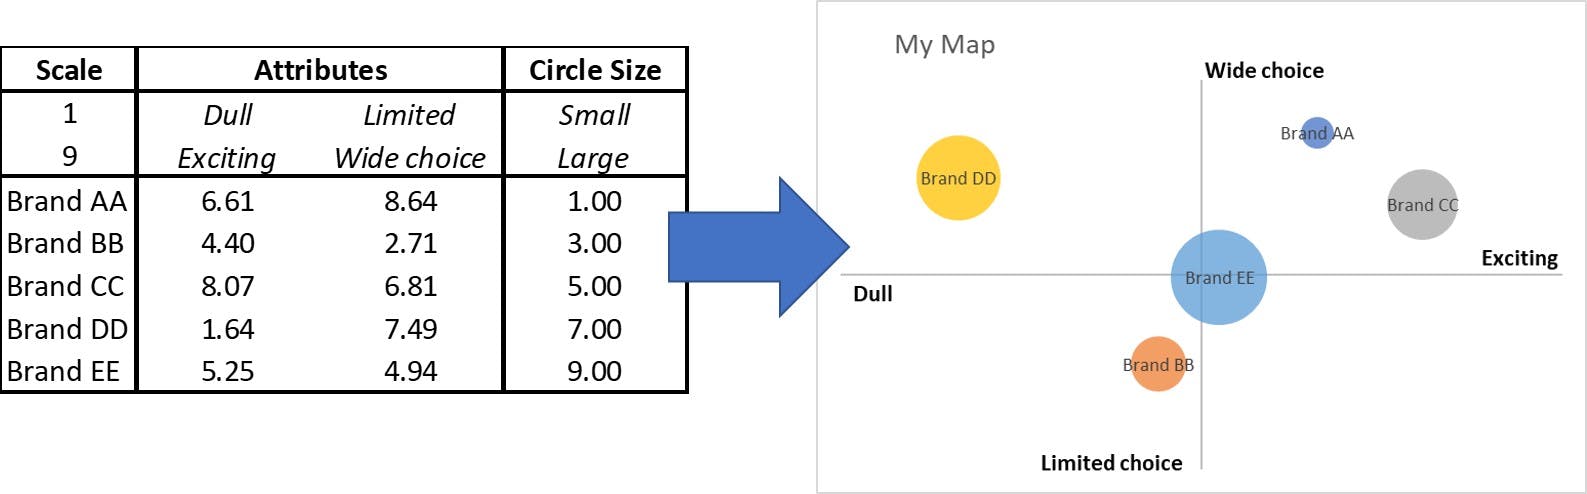
Give each competitor a score from 1 to 9 for the determinant attributes. Then assign a score to your product to see where it will be plotted on the map. If you have relevant data collected from the market research study, you do not need to estimate the parameters but use the results instead. Otherwise, list the criteria for comparison within the logic of MECE framework, and rate the attributes based on available information. Finally, draw a map and place the competitors in the corresponding positions.
Share and analyze the map
Share your perceptual map with stakeholders to estimate the success of your marketing strategies and understand what changes you can make to your product or brand management. With these findings, you can evaluate your progress over time and improve customers’ perceptions of the brand. It is crucial to create several perception maps to visualize the market in various ways and uncover opportunities or risks to your product’s position.
A perceptual map helps you understand whether your business model is similar to the competing companies, and you need to find ways to stand out. If your customers’ perceptions are inaccurate, you should think of changing a product marketing strategy. The other advantage of creating a perceptual map is a chance to identify a gap in the market and use it to your advantage.
Perceptual map template tools
Creating a perceptual map might seem a little complicated. However, there are some tools and templates to make it easier.
Visual Paradigm Online is a tool for making perceptual maps that provide over 2,000 ready-made templates for hotels, restaurants, vehicles, drinks, and other products and companies. You can apply multiple formats, share diagrams with colleagues and customers, add comments and embed the maps into Microsoft Word, Excel, and PowerPoint documents and presentations.
Miro is a collaborative tool for brainstorming ideas, taking notes, or visualizing the concepts online with your team. You can create a perceptual map using a template where you can draw two or more axes and circles of different sizes to reflect the sales volume or market share of competing products.
Alchemer is a survey tool for market researchers who need to gather customer data. It helps your company better understand the market and collect feedback to make decisions, test theories, and reveal new possibilities.
GroupMap allows for creating several types of perceptual maps using templates or designing a customized diagram. The tool also has a feature for creating surveys and polls for your customers and brainstorming ideas.
With perceptual maps, you can gain valuable insights into your product’s strengths and weaknesses, compare it to other offers and identify market trends. Perceptual maps will help you see things from the customers’ perspective so that you can to improve your branding and marketing strategies. It is vital to note that perceptual mapping is a dynamic process. Map changes because of market shifts and the emergence of new trends and products. Thus, you always need to keep abreast of new developments and be ready to adapt to the challenges.